WordPressを使用していて
ちょうどグラフを描けるプラグインを探していて
GoogleGraphを見つけたので備忘録として。
作れるグラフは7タイプで
ショートコード対応になっています。
= Supported shortcodes =
* geoChart
* lineChart
* columnChart
* barChart
* pieChart
* bubbleChart
* ScatterChart
Geo Chart
Line Chart
Bar Chart
readme.txtを見るとやり方が書いてあるんですけど
英語なのでいまいち?
いちいち開くのも面倒なので。。。
コードの例がのっているのでそのままペースト。。。
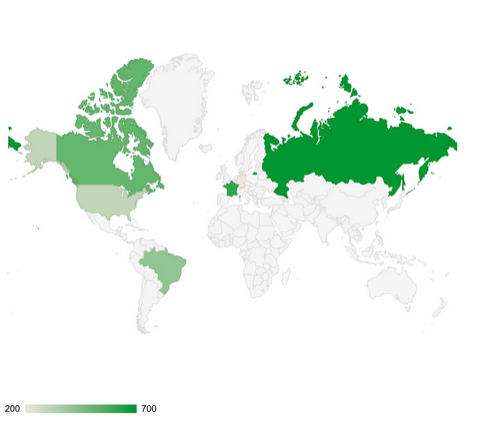
= Geo Chart Example =
☆geoChart width=”700px” height=”700px” ]
[‘Country’, ‘Popularity’],
[‘Germany’, 200],
[‘United States’, 300],
[‘Brazil’, 400],
[‘Canada’, 500],
[‘France’, 600],
[‘RU’, 700]
[/geoChart★
コードをコピーして使用する場合は
☆=[
★=]
に置き換え。以下同じ。
widthとheightを100%に変更
Powered by TSBA.mobi GoogleGraph Wordpress plugin
☆geoChart width=”700px” height=”700px” displaymode=”markers” region=”MK”]
[‘City’, ‘Population’, ‘Area’],
[‘Skopje’, 2761477, 1285.31],
[‘Bitola’, 1324110, 181.76],
[‘Prilep’, 959574, 117.27],
[‘Ohrid’, 907563, 130.17],
[‘Shtip’, 655875, 158.9],
[‘Gevgelija’, 607906, 243.60],
[‘Resen’, 380181, 140.7],
[‘Kriva Palanka’, 371282, 102.41],
[‘Kavadarci’, 67370, 213.44],
[‘Negotino’, 52192, 43.43],
[‘Tetovo’, 38262, 11]
[/geoChart★
widthとheightを100%に変更
Powered by TSBA.mobi GoogleGraph Wordpress plugin
☆geoChart width=”700px” height=”700px” colorstart=”#e7711c” colorend=”#4374e0″]
[‘Country’, ‘Popularity’],
[‘Germany’, 200],
[‘United States’, 300],
[‘Brazil’, 400],
[‘Canada’, 500],
[‘France’, 600],
[‘RU’, 700]
[/geoChart★
Powered by TSBA.mobi GoogleGraph Wordpress plugin
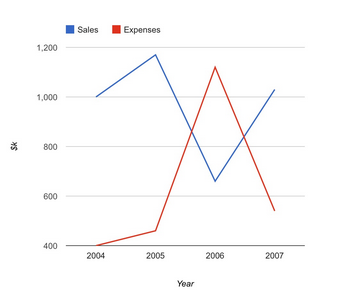
= Line Chart Example =
☆lineChart width=”600px” height=”500px”
legend=”{ position: ‘top’, maxLines: 1 }”
vaxis=”{title: ‘$k’, titleTextStyle: {color: ‘black’}}”
haxis=”{title: ‘Year’, titleTextStyle: {color: ‘black’}}”
curvetype=”none”]
[‘Year’, ‘Sales’, ‘Expenses’],
[‘2004’, 1000, 400],
[‘2005’, 1170, 460],
[‘2006’, 660, 1120],
[‘2007’, 1030, 540]
[/lineChart★
Powered by TSBA.mobi GoogleGraph Wordpress plugin
☆lineChart curvetype=”function” width=”600px” height=”500px” stacked=”1″
legend=”{ position: ‘top’, maxLines: 1 }”
vaxis=”{title: ‘$k’, titleTextStyle: {color: ‘black’}}”
haxis=”{title: ‘Year’, titleTextStyle: {color: ‘black’}}”
curvetype=”function”]
[‘Year’, ‘Sales’, ‘Expenses’],
[‘2004’, 1000, 400],
[‘2005’, 1170, 460],
[‘2006’, 660, 1120],
[‘2007’, 1030, 540]
[/lineChart★
Powered by TSBA.mobi GoogleGraph Wordpress plugin
= Column Chart Example =
☆columnChart width=”500px”
legend=”{ position: ‘top’, maxLines: 2 }”
vaxis=”{title: ‘in $000’, titleTextStyle: {color: ‘blue’}}”
haxis=”{title: ‘Year’, titleTextStyle: {color: ‘blue’}}”]
[‘Year’, ‘Sales’, ‘Expenses’],
[‘2004’, 1000, 400],
[‘2005’, 1170, 460],
[‘2006’, 660, 1120],
[‘2007’, 1030, 540]
[/columnChart★
Powered by TSBA.mobi GoogleGraph Wordpress plugin
☆columnChart width=”300px” stacked=”1″
legend=”{ position: ‘top’, maxLines: 2 }”
vaxis=”{title: ‘in $000’, titleTextStyle: {color: ‘blue’}}”
haxis=”{title: ‘Year’, titleTextStyle: {color: ‘blue’}}”]
[‘Year’, ‘Visitations’, { role: ‘style’ } ],
[‘2010’, 10, ‘color: gray’],
[‘2010’, 14, ‘color: #76A7FA’],
[‘2020’, 16, ‘opacity: 0.2’],
[‘2040’, 22, ‘stroke-color: #703593; stroke-width: 4; fill-color: #C5A5CF’],
[‘2040’, 28, ‘stroke-color: #871B47; stroke-opacity: 0.6; stroke-width: 8; fill-color: #BC5679; fill-opacity: 0.2’]
[/columnChart★
Powered by TSBA.mobi GoogleGraph Wordpress plugin
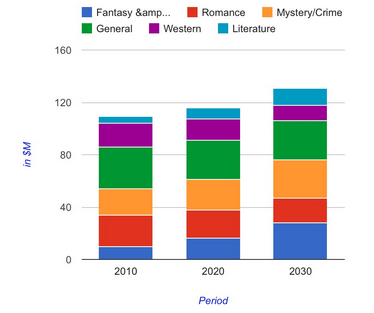
☆columnChart width=”500px” stacked=”1″
legend=”{ position: ‘top’, maxLines: 2 }”
vaxis=”{title: ‘in $M’, titleTextStyle: {color: ‘blue’}}”
haxis=”{title: ‘Period’, titleTextStyle: {color: ‘blue’}}”]
[‘Genre’, ‘Fantasy & Sci Fi’, ‘Romance’, ‘Mystery/Crime’, ‘General’,’Western’, ‘Literature’, { role: ‘annotation’ } ],
[‘2010’, 10, 24, 20, 32, 18, 5, ”],
[‘2020’, 16, 22, 23, 30, 16, 9, ”],
[‘2030’, 28, 19, 29, 30, 12, 13, ”],
[/columnChart★
Powered by TSBA.mobi GoogleGraph Wordpress plugin
= Bar Chart Example =
☆barChart width=”500px” stacked=”1″
legend=”{ position: ‘top’, maxLines: 2 }”
vaxis=”{title: ‘in $000’, titleTextStyle: {color: ‘blue’}}”
haxis=”{title: ‘Year’, titleTextStyle: {color: ‘blue’}}”]
[‘Year’, ‘Sales’, ‘Expenses’],
[‘2004’, 1000, 400],
[‘2005’, 1170, 460],
[‘2006’, 660, 1120],
[‘2007’, 1030, 540]
[/barChart★
Powered by TSBA.mobi GoogleGraph Wordpress plugin
☆barChart width=”500px” stacked=”1″
legend=”{ position: ‘top’, maxLines: 2 }”
vaxis=”{title: ‘in $000’, titleTextStyle: {color: ‘blue’}}”
haxis=”{title: ‘Year’, titleTextStyle: {color: ‘blue’}}”]
[‘Year’, ‘Visitations’, { role: ‘style’ } ],
[‘2010’, 10, ‘color: gray’],
[‘2010’, 14, ‘color: #76A7FA’],
[‘2020’, 16, ‘opacity: 0.2’],
[‘2040’, 22, ‘stroke-color: #703593; stroke-width: 4; fill-color: #C5A5CF’],
[‘2040’, 28, ‘stroke-color: #871B47; stroke-opacity: 0.6; stroke-width: 8; fill-color: #BC5679; fill-opacity: 0.2’]
[/barChart★
Powered by TSBA.mobi GoogleGraph Wordpress plugin
☆barChart width=”500px” stacked=”1″
legend=”{ position: ‘top’, maxLines: 2 }”
vaxis=”{title: ‘in $M’, titleTextStyle: {color: ‘blue’}}”
haxis=”{title: ‘Period’, titleTextStyle: {color: ‘blue’}}”]
[‘Genre’, ‘Fantasy & Sci Fi’, ‘Romance’, ‘Mystery/Crime’, ‘General’,’Western’, ‘Literature’, { role: ‘annotation’ } ],
[‘2010’, 10, 24, 20, 32, 18, 5, ”],
[‘2020’, 16, 22, 23, 30, 16, 9, ”],
[‘2030’, 28, 19, 29, 30, 12, 13, ”],
[/barChart★
Powered by TSBA.mobi GoogleGraph Wordpress plugin
= Pie Chart Example =
☆pieChart title=”ここがタイトル” width=”400px” ]
[‘Task’, ‘Hours per Day’],
[‘Work’, 11],
[‘Eat’, 2],
[‘Commute’, 2],
[‘Watch TV’, 2],
[‘Sleep’, 7]
[/pieChart★
Powered by TSBA.mobi GoogleGraph Wordpress plugin
= Bubble Chart Example =
☆bubbleChart width=”400px” vaxis=”{title: ‘X’, titleTextStyle: {color: ‘black’}}” haxis=”{title: ‘Y’, titleTextStyle: {color: ‘black’}}” colorstart=’yellow’ colorend=’red’ bubble=”{textStyle: {auraColor: ‘none’}}”]
[‘ID’, ‘X’, ‘Y’, ‘Temperature’],
[‘a’, 80, 167, 120],
[‘b’, 79, 136, 130],
[‘c’, 78, 184, 50],
[‘d’, 72, 278, 230],
[‘e’, 81, 200, 210],
[‘f’, 72, 170, 100],
[‘g’, 68, 477, 80]
[/bubbleChart★
Powered by TSBA.mobi GoogleGraph Wordpress plugin
☆bubbleChart width=”600px” vaxis=”{title: ‘Fertility Rate’}” haxis=”{title: ‘Life Expectancy’}” bubble=”{textStyle: {fontSize: 11}}” title=”Correlation between life expectancy, fertility rate and population of some world countries (2010)”]
[‘ID’, ‘Life Expectancy’, ‘Fertility Rate’, ‘Region’, ‘Population’],
[‘CAN’, 80.66, 1.67, ‘North America’, 33739900],
[‘DEU’, 79.84, 1.36, ‘Europe’, 81902307],
[‘DNK’, 78.6, 1.84, ‘Europe’, 5523095],
[‘EGY’, 72.73, 2.78, ‘Middle East’, 79716203],
[‘GBR’, 80.05, 2, ‘Europe’, 61801570],
[‘IRN’, 72.49, 1.7, ‘Middle East’, 73137148],
[‘IRQ’, 68.09, 4.77, ‘Middle East’, 31090763],
[‘ISR’, 81.55, 2.96, ‘Middle East’, 7485600],
[‘RUS’, 68.6, 1.54, ‘Europe’, 141850000],
[‘USA’, 78.09, 2.05, ‘North America’, 307007000]
[/bubbleChart★
Powered by TSBA.mobi GoogleGraph Wordpress plugin
マウスオーバーで数値等でるし、便利そう。。
でもreadme.txtにScatterChartのコードが書いてなかったけど、、、
まあ、いいか。。。